From Castlebar - County Mayo -
Public Service - Value for Money?
By Jo and Joe Civil Servant
27, Nov 2008 - 07:31
Public service unions fight their corner with some facts setting the record straight - six examples of misinformation or just straight damn lies about the civil service.
The public service - you know the stuff like schools, hospitals and social welfare - is a drag on the rest of the economy and a crowding out of other economic activity?
- Ireland has the third smallest public sector expenditure as % of GDP across OECD (2005) ahead of only Korea and Mexico, (Source: OECD Public Management Review 2008).
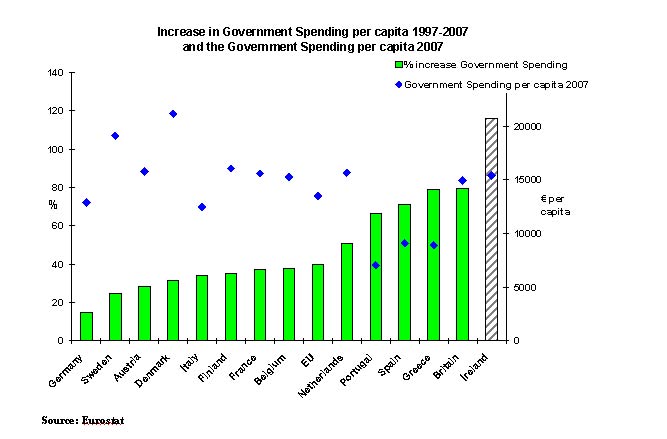
- The Irish Public Sector is by far the smallest of the old EU member states. Irish Government Expenditure is only 34.2% of GDP compared to 44.6% in the UK (Source; Eurostat, 2006) and 55.6% in Sweden and is only comparable with. some of the developing economies of central and Eastern Europe such as Bulgaria, Romania and the Baltic States.
- Irish Government transfers to semi-state bodies is the 5th lowest across the OECD (2005) at 13.3%, (Source: OECD Public Management Review 2008).
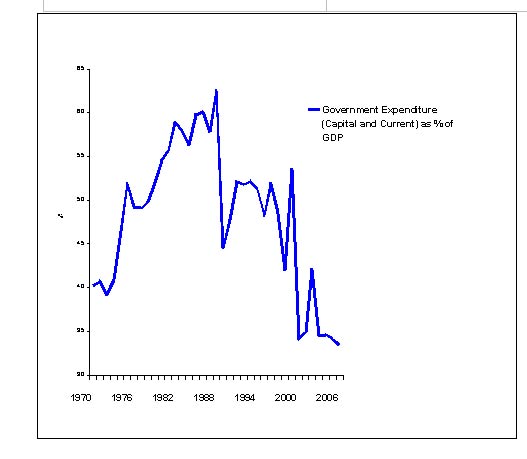
Government Expenditure as a proportion of GDP. (Source CSO National Accounts)
|
Irish Government spending has for seven years now averaged growth 40% faster than the rate of growth in the economy (FG (2008) “Recovery through reform”)
- This allegation from Fine Gael is just plain wrong.
- Despite the large increase in infrastructural investment in this decade, Current and Capital Government spending grew at a slower rate of 66% between 2000 and 2006 compared to a 69% increase in GDP over that time, (Source: CSO National Accounts, Dept. of Finance Budgetary Statistics and Tables).
The increase in public spending over the past decade has been far larger than in any of the other 11 long standing members of the Eurozone. (Dan O’ Brien, Economist Intelligence Unit)
- Government spending per capita has increased by 62% between 2000 and 2006 (Eurostat, 2008) but as the OECD acknowledge; this was part of a catching up process and brings us up to levels of Finland, Netherlands, Austria and France.
- Despite the increase in spending, the actual levels remain far behind. In 2005, health expenditure in Ireland was 8.2% of GDP, compared with an OECD average of 8.9% and in the USA, it was 15.2% of GDP, (Source: OECD, 2005)
- Private health spending makes up over 55% of total health spend per capita in the US, yet the 45% share of spending per person that is public funding amounts to over 90% of the €2450 total average health spend per person (private and public) in Ireland. (Source: OECD Statistical Database, 2005).
A vastly bloated Public sector?
- Between 1987 and 2007, the improvement in the ratio of public sector workers to citizens has been a very marginal. In 1987, there was one public servant to 13 citizens, in 2007, the ratio has been reduced to 1: 12, (Source: CSO QNHS).
- Public sector as share of all those in employment was 24.7% in 1988. Over the first three months of 2008, it was 17.2%, (Source: CSO QNHS).
- OECD Public Management review report of Ireland (2008), noted that “as compared with other OECD countries, 2005 data indicate that general government employment in Ireland…. is relatively low among OECD countries and is significantly less than the level of public employment in Norway (28%), Sweden (27%), France (23%) , Finland (22%) and Belgium (17%).
- Notwithstanding the increase in pubic sector employment since 2005, that now brings the share of those in the public sector 17.2%, Ireland still compares favorably.
Overpaid and underworked- the cosy job of public servants?
- The starting salary of a clerical officer is €23,221, rising to €35,727 after 12 years service, which does not even meet average industrial earning in the private sector of €38,093.
- A staff nurse can expect a salary below present-day average industrial wage for the first six years of service, having started at a level of €30,339.
- A special-needs assistant starts out on €23,232 with paltry increments bringing pay to €36,189 after 12 years service.
Higher wage bill relative to private sector must mean overpay?
A number of key features that distinguish public and private sector and which account for higher average earnings in the public service.
- Just over 69% of all public sector workers (excluding those in semi-state companies) have a third level qualification, relative to the private sector where only 28% of workers have a post secondary education (Source: Census, 2006).
- It thus follows that a higher concentration of professionals will result in a higher average earnings ratio when compared to the private sector.
- In addition, only 9.3% of the public sector are not Irish born relative to a share of 17.9% of the private sector. Given that migrant workers, in particular those who come the new member states of the EU account for 7% of total employment, earn between 10% and 18% less than Irish workers, (Source: Barrett et al, 2008), this would have a significant drag effect on private sector earnings.
Source: Census 2006
|
Employment |
Public Sector |
Private Sector |
|
Low Skilled |
7% |
29.9% |
|
Medium Skilled |
16.7% |
31.1% |
|
High Skilled |
69.3% |
28.6% |
|
Non Irish Component |
9.3% |
17.9% |
© Copyright 2008 by Castlebar - County Mayo -
|